

Dashboards are rolling out gradually. If you don’t see Dashboards in your sidebar, reach out to support@metal.ai to have it enabled for your firm.
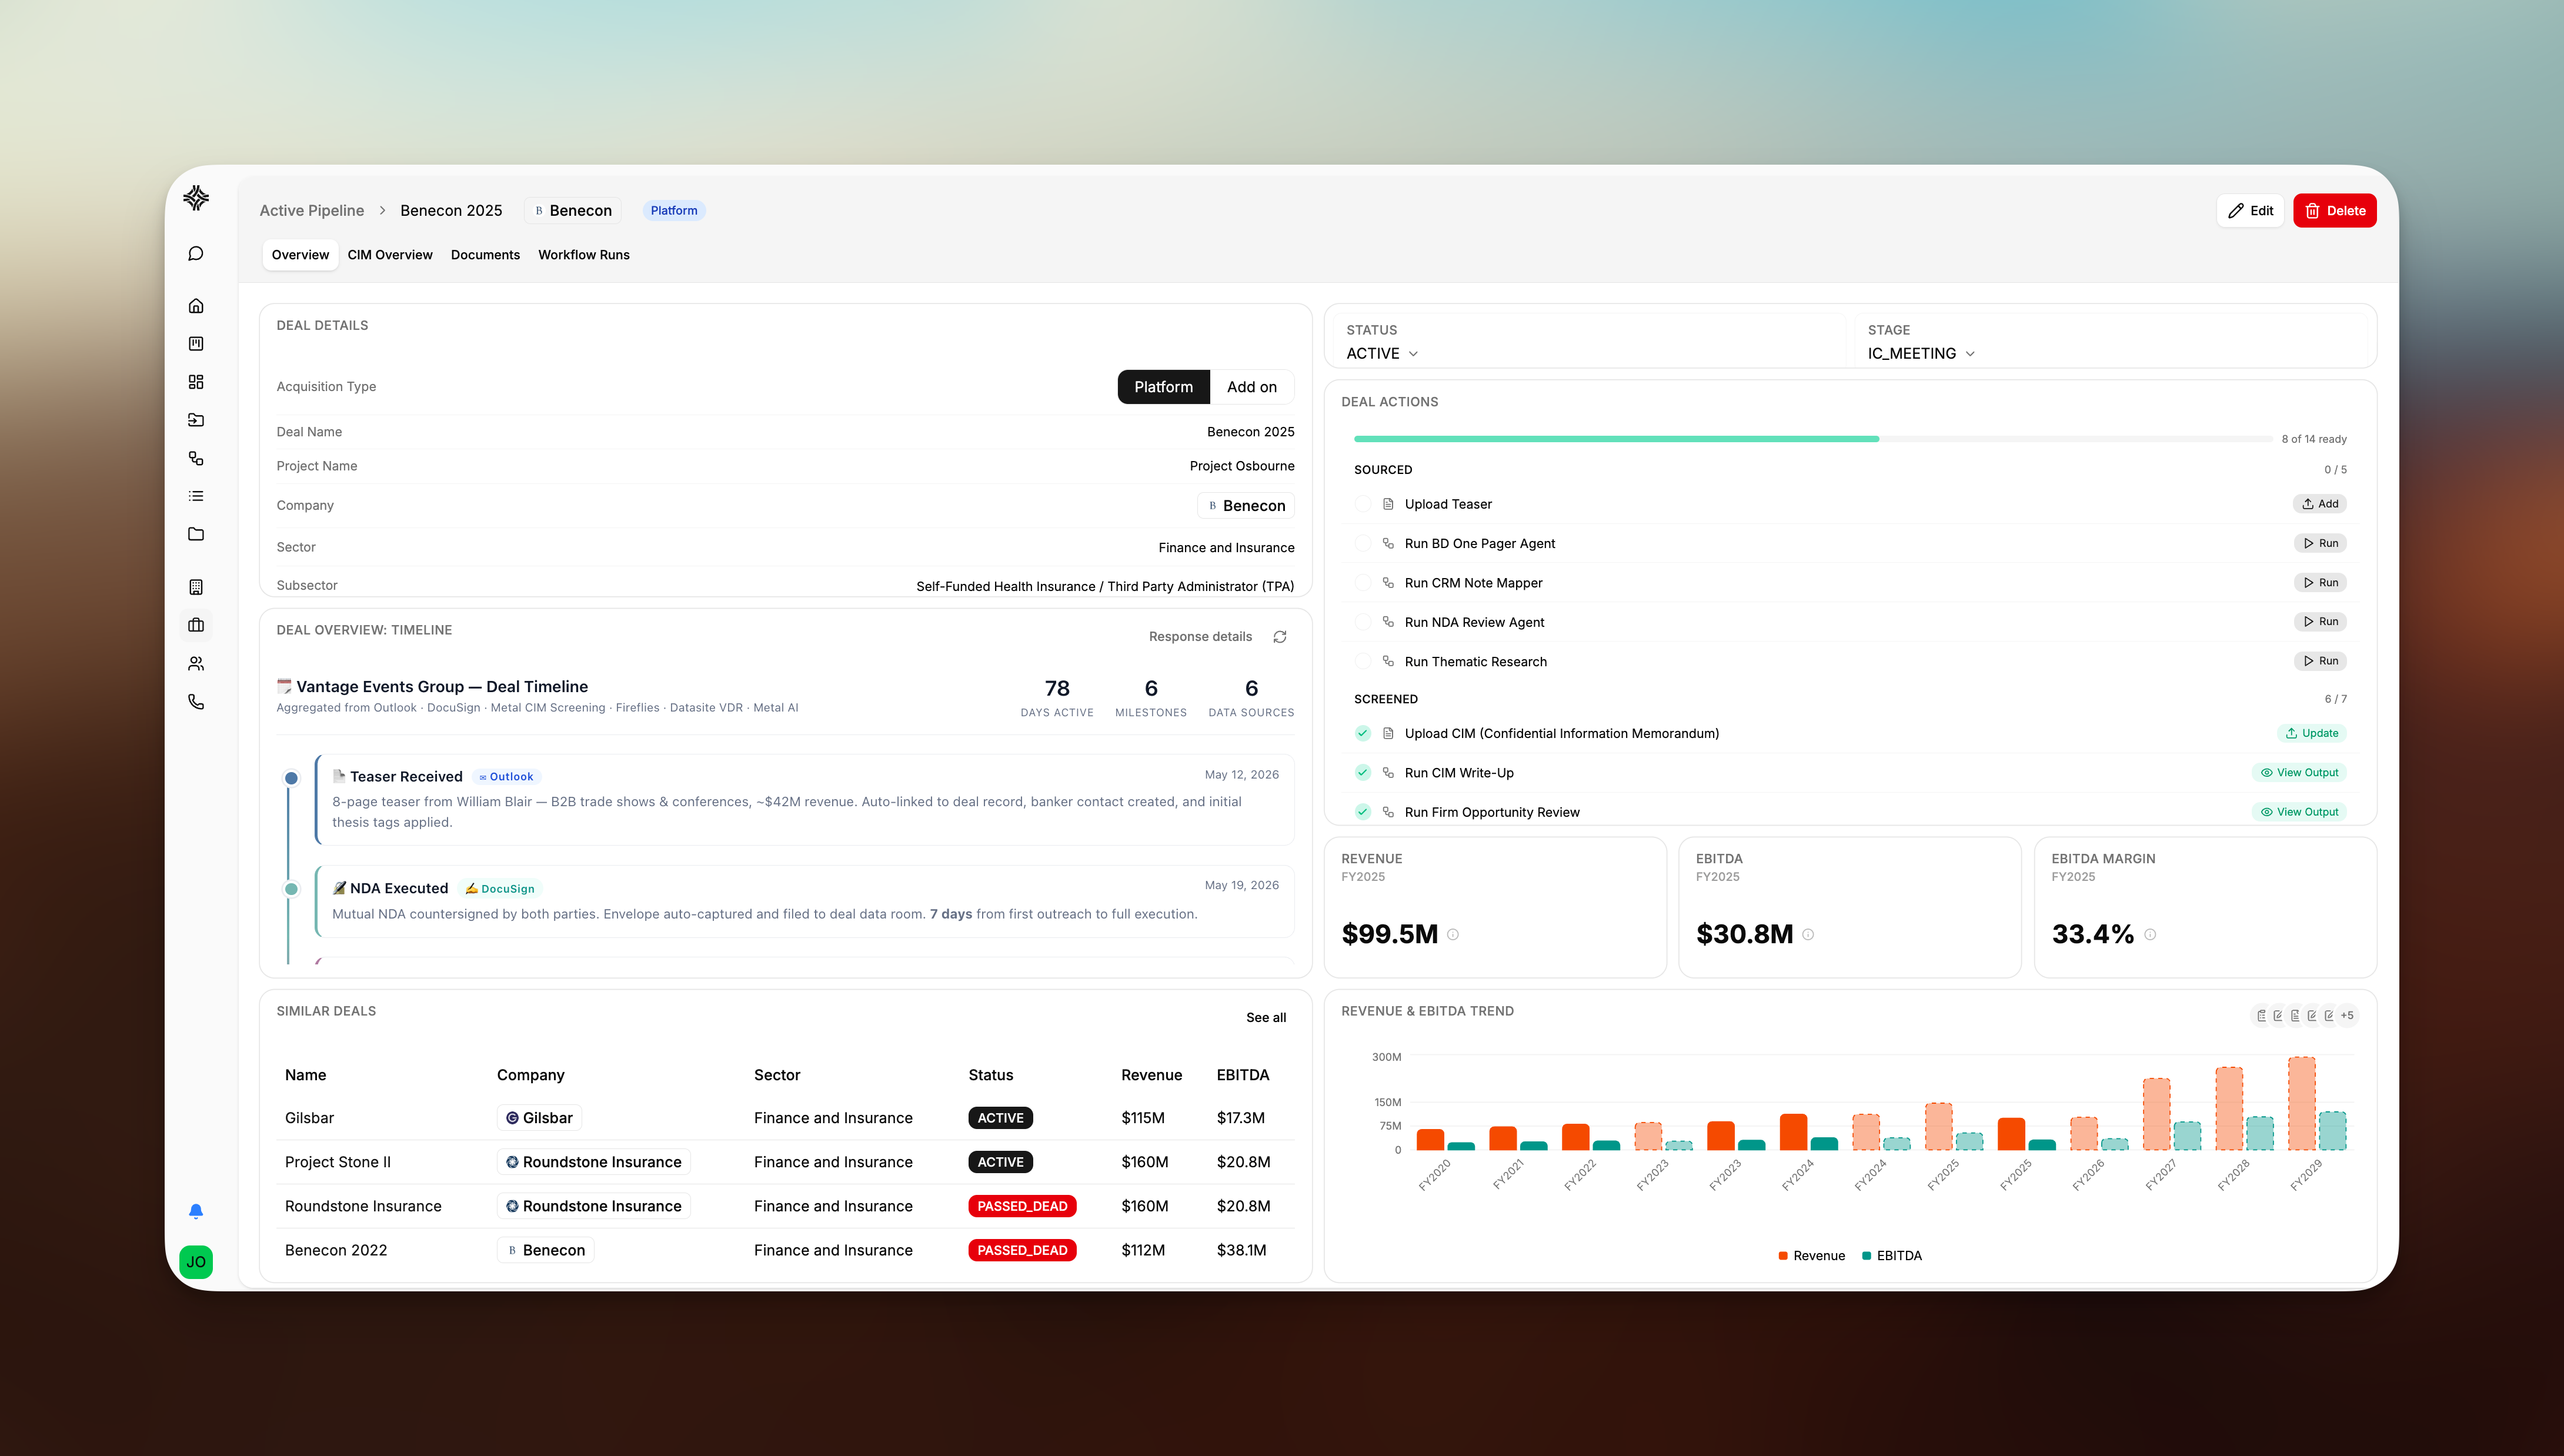
A dashboard brings deal details, actions, milestones, and key metrics into one view.
The Dashboards gallery
Select Dashboards in the left sidebar to open the gallery. It’s split into two sections:
Each card shows the dashboard’s name, description, and whether it’s shared. Click a card to open the dashboard.
Create a dashboard
1
Open the gallery
Select Dashboards in the sidebar.
2
Start a new dashboard
Click New dashboard next to the My Dashboards heading.
3
Name and describe it
Give the dashboard a Name and an optional Description (for example, Q3 Portfolio Review). Click Create.
Add widgets
Widgets are the individual charts, tables, and metrics on a dashboard. You add them from the Add widget gallery and edit them from the widget’s header.Open the gallery
Click Add widget in the dashboard header. On an empty dashboard, the same picker opens automatically. The gallery has two paths:- Compose a new widget — describe what you want and let Metal build it.
- Pick from the widget library — start from a ready-made widget curated for this dashboard’s context (canvas, pipeline, deal, or company).
Compose a new widget
1
Choose how the widget gets its data
Pick one of two kinds:
- Data — Metal writes a script that pulls directly from your Metal and CRM data. The widget refreshes on every load. Best for numbers, charts, and lists you want to keep current.
- Research — an AI agent researches your prompt across your Metal data, documents, and the web. Best for summaries, themes, and open-ended questions.
2
Describe what you want to see
In What do you want to see?, describe the widget in plain language — for example, “Deals by sector this year” or “Which deals look stalled and why?”. The placeholder shows an example tailored to this dashboard’s context.
3
Create the widget
Click Create widget. A placeholder tile lands on the dashboard immediately, chat opens, and Metal starts building the widget from your description. You can keep refining it in the same chat thread.
Pick from the widget library
Under Examples in the same dialog, Metal shows a curated set of pre-built widgets scoped to this dashboard’s context. Click one to drop it straight onto the dashboard — library widgets arrive fully configured, so there’s no chat hand-off.The library is curated per dashboard context. Canvas, pipeline, deal, and company dashboards each get their own set; other dashboard types show no library entries yet, and you compose from scratch.
Arrange the layout
Click Edit layout in the header. Drag widgets to move them, drag their edges to resize, and use the delete control on a widget to remove it. Click Done to save.Inspect or edit a widget’s source
Every widget is backed by either a script (for data queries) or a prompt (for AI-generated content). Click the pencil icon in a widget’s header to open the source dialog, where a Script or Prompt badge (with a matching code or bot icon) tells you which kind it is. From there you can view — or inline-edit — the underlying script or prompt. Read-only widgets show an eye icon instead. Widgets you customize are marked with a Custom badge.Share a dashboard
You control who can see a dashboard from the Share dialog in the dashboard header.1
Open the share dialog
On the dashboard, click Share in the header.
2
Add users or teams
Under Shared with, add individual Users or whole Teams. Everyone you add sees the dashboard under Shared with me in their gallery.
3
Make it org-wide (optional)
Toggle Public to make the dashboard visible to everyone in your organization. Public dashboards show an Org-wide badge in the gallery.
Dashboards vs. Default Dashboards
Metal has two related surfaces. Use this table to pick the right one:
If you want a firm-wide reporting view, use a top-level dashboard. If you want every deal (or every company, list, or user profile) to open with the same widgets by default, configure that under Settings → Default Dashboards.
Related
Workspace settings
Where admins configure Default Dashboards and other firm-wide preferences.
Adding & managing users
Set up teams so you can share dashboards with a whole group at once.